A Guide to Accounts Payable Performance Metrics
Accounts payable performance metrics are the numbers that tell you how efficiently, accurately, and cost-effectively your AP process is running. Think of them as the vital signs for your company's financial health, showing you exactly how well your team is managing invoices, payments, and supplier relationships.
Why AP Metrics Are Your Financial Dashboard
Ever tried flying a plane without an instrument panel? That’s what running an Accounts Payable department without clear metrics feels like. You might be moving forward, but you have no real data on your speed, altitude, or fuel levels to make smart decisions.
Tracking the right AP performance metrics changes everything. It turns your AP department from a simple cost center into a strategic hub for financial intelligence. These numbers provide a real-time dashboard for some of your most critical financial operations, giving you clear, objective answers to tough questions:
- Are we spending too much to process a single invoice?
- Are payments getting stuck in approval bottlenecks?
- Are we keeping our suppliers happy?
By keeping an eye on these key indicators, you start to see inefficiencies and opportunities that were invisible before. This guide will walk you through the core metrics that every high-performing AP team tracks, giving you a clear roadmap to get your own operations in order. For a deeper dive into workflow optimization, check out our guide on accounts payable process improvement.
Shifting from Reactive to Proactive Management
Without metrics, most AP teams are stuck in a reactive loop, putting out fires like late payment fees or angry supplier calls only after they happen. Performance measurement flips that dynamic on its head.
By consistently tracking metrics like invoice cycle time and exception rates, you gain the foresight to identify potential issues before they damage your cash flow or supplier trust. This proactive approach is the hallmark of a modern, high-performing finance team.
Instead of just pushing paper (or PDFs), your department becomes a source of valuable business insight. For instance, a slow climb in your invoice exception rate might be an early warning sign that you need to clarify things with the procurement team or improve your vendor onboarding process. This is how you start making decisions based on data, not just gut feelings.
The Foundation of Financial Strategy
At the end of the day, strong AP performance isn't just about operational neatness; it's a strategic advantage. The data you pull from your AP dashboard directly feeds into your company's bigger financial picture.
It helps you:
- Optimize Cash Flow: Know exactly when to pay suppliers to either maximize your working capital or snag valuable early payment discounts.
- Strengthen Supplier Relationships: Timely, accurate payments build trust and goodwill, which can lead to better terms and more reliable partnerships down the road.
- Improve Budgeting and Forecasting: When you have clean, accurate data on spending patterns, your financial planning becomes far more reliable.
When you embrace these metrics, you transform a transactional, back-office function into a powerful engine for financial stability and growth.
The Five Essential AP Metrics You Must Track
Think of your AP department as the economic engine of your business. To keep that engine humming, you need a dashboard with clear, reliable gauges. These gauges are your accounts payable performance metrics. They tell you how efficiently you're using fuel (money and time), how fast you're moving, and whether you're heading for trouble.
Let's break down the five most critical metrics that every finance team, no matter the size, should have on their radar. Nailing these will give you the visibility to turn your AP function from a simple cost center into a strategic powerhouse.
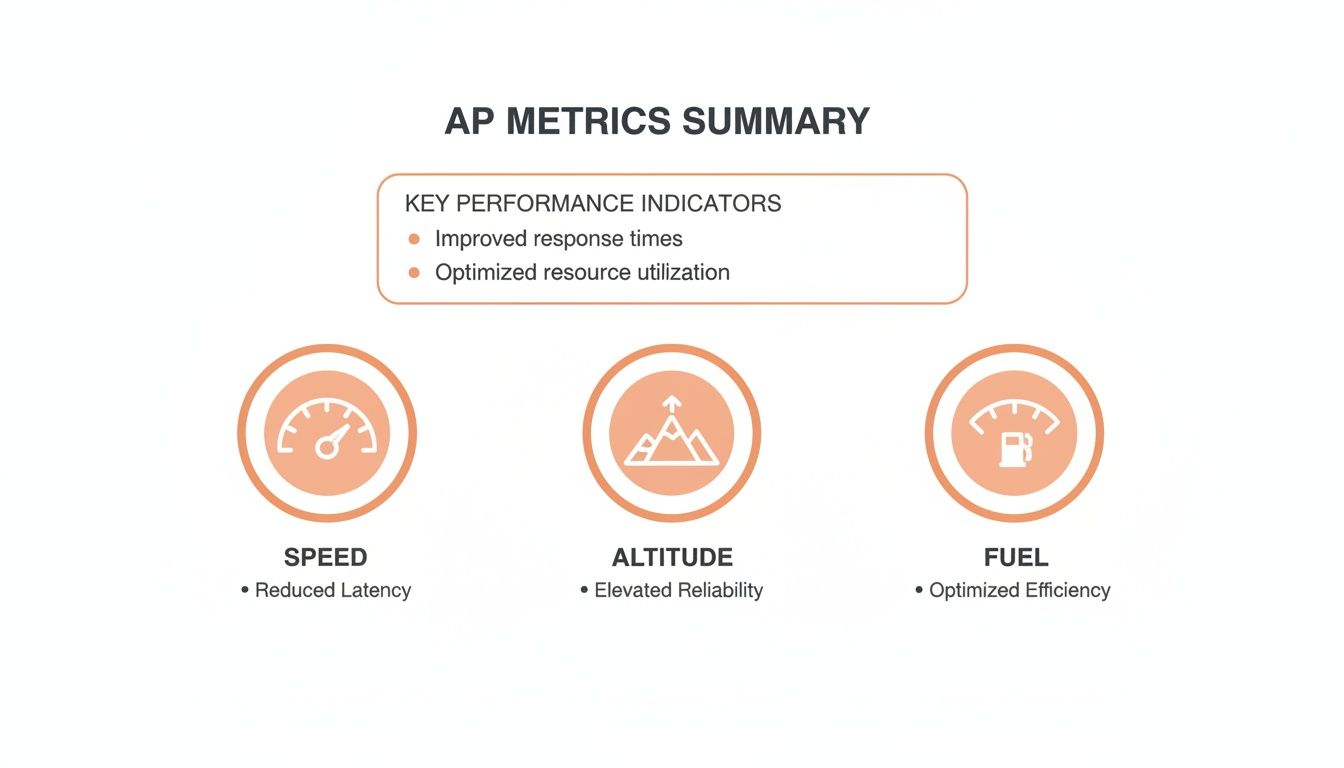
This graphic gives you a quick snapshot of how these metrics work together. Just like a pilot's control panel, each one offers a unique view into your operational health—from the raw speed of your invoice processing to the efficiency of your cash management.
Quick Reference Guide to Key AP Metrics
Before we dive deep into each metric, here’s a handy table summarizing the essentials. Think of this as your cheat sheet for understanding the health of your AP operations at a glance.
| Metric Name | What It Measures | Standard Formula | Why It Matters |
|---|---|---|---|
| Cost Per Invoice | The total, all-in cost to process one invoice from receipt to payment. | Total AP Dept Costs / Total Invoices Processed |
It’s a direct measure of your AP team's overall efficiency. High costs point to manual work and friction. |
| Invoice Cycle Time | The average time it takes for an invoice to move from receipt to final approval. | Date of Payment Approval - Date of Invoice Receipt |
Long cycles mean bottlenecks, missed discounts, and strained vendor relationships. |
| Invoice Exception Rate | The percentage of invoices that require manual intervention to be processed. | (# of Exception Invoices / Total # of Invoices) x 100 |
Exceptions kill automation. A high rate means your process is broken somewhere upstream. |
| PO Match Rate | The percentage of invoices that match a purchase order without any manual fixes. | (# of First-Time Matches / Total PO Invoices) x 100 |
This is the key to touchless processing. A high rate signifies a well-oiled procurement process. |
| Days Payable Outstanding (DPO) | The average number of days it takes your company to pay its suppliers. | (Ending AP / COGS) x # of Days in Period |
DPO is a strategic lever for managing working capital and balancing cash flow with supplier health. |
With that overview, let's unpack what each of these numbers really means for your business.
1. Cost Per Invoice
What It Measures: This is the most straightforward, yet revealing, of all AP metrics. It calculates the total, all-in cost to process a single invoice, from the moment it hits your inbox to the second it's paid.
Think of it like the cost to ship a package. It isn’t just the postage. You have to account for the box, the tape, the time it takes to pack it, and the trip to the post office. Your cost per invoice is the same—it includes salaries, benefits, software licenses, bank fees, and even a slice of the office rent.
How to Calculate It:
Formula: Total AP Department Costs / Total Number of Invoices Processed (in a given period)
To get a real number, you have to be brutally honest about all the associated costs. This means direct labor (time spent on data entry, approvals, payment runs) and indirect overhead (rent, utilities, and IT support for the AP function).
Why It Matters: This metric is your efficiency barometer. A high cost per invoice is a massive red flag, pointing directly to manual, labor-intensive processes. When your team is burning hours keying in data, chasing down approvals, and stuffing envelopes, your costs go through the roof.
Top-performing AP teams process over three times more invoices than their peers, and their cost per invoice is nearly four times lower. Bottom performers often hover around $10-15 per invoice, while top-tier teams using automation get it down under $3-4. For more benchmarks, check out this data on accounts payable key performance metrics at Auxis.com.
2. Invoice Cycle Time
What It Measures: Also known as Invoice Processing Time, this metric tracks the average time an invoice spends on its journey through your system—from arrival to final payment approval.
Picture it as a relay race. The clock starts the moment the invoice is handed off to your team and stops only when it has passed every checkpoint (data entry, coding, approval, final review) and is ready at the finish line.
How to Calculate It:
Formula: (Date of Payment Approval - Date of Invoice Receipt) / Total Number of Invoices Processed
This is usually measured in days. A world-class AP department can get this down to just over 3 days, while less efficient teams can take 15, 20, or even 30 days.
Why It Matters: A long cycle time is a symptom of hidden bottlenecks. It could be a manager who sits on approvals, a clunky coding process, or just the time it takes to manually type data from a PDF. These delays aren't just an internal headache; they have real financial consequences:
- Lost Early Payment Discounts: Many suppliers offer a 1-2% discount for paying early. Slow processing makes capturing these savings impossible.
- Strained Supplier Relationships: No one likes to be paid late. Consistently slow payments erode trust and can lead to suppliers putting you on credit hold.
- Poor Cash Flow Visibility: When you have no idea how long invoices will be in the pipeline, forecasting your cash needs becomes a guessing game.
3. Invoice Exception Rate
What It Measures: An "exception" is any invoice that gets kicked out of the normal workflow and needs a human to step in and fix something. This metric tracks the percentage of your total invoices that fall into this bucket.
Imagine an automated assembly line. An exception is like a product that gets pulled off because a part is missing or doesn't fit. Someone has to stop what they're doing, figure out the problem, and fix it by hand.
How to Calculate It:
Formula: (Number of Invoices with Exceptions / Total Number of Invoices) x 100
Exceptions are usually caused by things like:
- Missing or incorrect purchase order (PO) numbers.
- Mismatched prices or quantities between the invoice and PO.
- Duplicate invoices.
- Out-of-date vendor information.
Why It Matters: Exceptions are the kryptonite of AP efficiency. They grind automation to a halt, eat up your team's most valuable time, and are a primary driver of both high costs and long cycle times. A high exception rate (anything over 10% is a problem) signals deeper issues in your procure-to-pay process.
Reducing this rate is non-negotiable. Tools like ExtractBill help by capturing invoice data with near-perfect accuracy from the start, slashing the data entry errors that cause so many exceptions.
4. PO Match Rate
What It Measures: This metric tells you what percentage of your invoices successfully match a corresponding purchase order (and maybe a goods receipt note, in a three-way match) on the very first try, with no corrections needed.
It's like matching your grocery store receipt to the items in your cart. A perfect match means every item and every price on the receipt lines up with what you actually bought. A mismatch means you have to stop and investigate.
How to Calculate It:
Formula: (Number of Invoices with a Successful First-Time Match / Total Number of PO-Based Invoices) x 100
A high PO match rate is the sign of a healthy, synced-up procurement and AP process. It means buyers are creating clean POs, and vendors are invoicing against them correctly.
Why It Matters: A high match rate is the key to "touchless" invoice processing. When an invoice perfectly matches the PO, it can often be approved and scheduled for payment automatically. No human hands required. That's the dream. A low match rate, on the other hand, means your team is stuck in the weeds, manually chasing down why things don't add up.
5. Days Payable Outstanding (DPO)
What It Measures: DPO calculates the average number of days it takes for your company to pay its suppliers. This is less of an operational metric and more of a high-level indicator of financial health.
Think of DPO as your company's cash "breathing room." A higher DPO means you're holding onto your cash longer, freeing it up for other business operations.
How to Calculate It:
Formula: (Ending Accounts Payable / Cost of Goods Sold) x Number of Days in Period
Why It Matters: DPO is a delicate balancing act.
- A high DPO can be a smart way to improve working capital. But if it gets too high—meaning you're consistently paying late—it can damage supplier relationships and put your supply chain at risk.
- A low DPO means you're paying suppliers very quickly. While that certainly keeps them happy, it might mean you're not using your cash as strategically as you could be.
The "right" DPO varies by industry, but tracking its trend over time gives you critical insight into your company's cash management strategy and overall financial stability.
Common Pitfalls When Measuring AP Performance
Tracking accounts payable metrics sounds simple enough, but a lot of teams fall into the same traps, turning their hard-earned data into noise. It’s not just about collecting numbers; it’s about measuring the right things, the right way. Getting this right is the difference between generating useless reports and creating real, actionable intelligence for your business.
The most common mistake? Focusing on vanity metrics. A team might brag about processing 10,000 invoices in a month, which sounds great on paper. But what if that number is hiding a 25% invoice exception rate? That’s 2,500 invoices that had to be kicked back for costly manual rework, completely wiping out any perceived efficiency.
Inconsistent Data Collection
Another massive hurdle is inconsistent data collection. If one person on your team starts the clock for invoice cycle time when an invoice hits the mailroom, but another starts it when it’s scanned into the system, your data is garbage. You can't trust it.
This lack of a standard process paints a distorted picture of performance, making it impossible to spot bottlenecks or know if your improvements are actually working.
To get clean, reliable data, you have to lay down some ground rules:
- Standardize Start and End Points: Get crystal clear on when the clock starts and stops for metrics like cycle time. Write it down and make sure everyone follows it.
- Use a Single Source of Truth: All your data should come from one place, whether it's your ERP or an automation platform. No more pulling numbers from random spreadsheets.
- Automate Data Capture: Let's be honest, manual tracking is a recipe for typos and forgotten entries. Using software to automatically log timestamps and other data is far more accurate.
Consistency is the foundation of any trustworthy reporting.
Measuring Without a Plan for Action
Collecting data just for the sake of it is a complete waste of time. A dashboard full of fancy charts is useless if it doesn't lead to concrete action. The whole point of measuring AP metrics isn't just to look back at what happened; it's to actively build a more efficient future.
The purpose of data is not just to be admired, but to be acted upon. If a metric doesn’t prompt a specific question or inspire a potential process change, you should question why you’re tracking it at all.
For example, if you see your PO match rate is consistently low, the goal isn't just to report the same bad news next month. The real action is to dig in and figure out why. Maybe your procurement process is broken, or perhaps the team needs better training on creating purchase orders. To see how this works in practice, check out our guide on the fundamentals of three-way matching for invoices.
Every metric should be the start of a conversation about how to get better.
By dodging these common mistakes—focusing on meaningful metrics, demanding data consistency, and tying every number to a potential action—you can build a performance tracking system that actually drives your AP operations forward.
How Automation Supercharges Your AP Metrics
Knowing your accounts payable performance metrics is the first step. Actually improving them is the real goal. This is where modern automation comes in, drawing a straight line from new tech to bottom-line results. By taking over the manual, repetitive tasks, automation doesn't just make things faster—it completely changes what your AP department is capable of.
Think of your AP team as a professional pit crew. Without automation, they're stuck using hand tools, manually jacking up the car and wrestling with tires. With automation, they get pneumatic air guns, hydraulic lifts, and high-speed fuel rigs. The goal is the same, but the speed, precision, and efficiency are in a totally different league.
This isn’t just about moving quicker. It’s about freeing your team from the grind of low-value work so they can shift their focus to strategic financial analysis, building better vendor relationships, and driving top-tier performance across the board.
Slashing Invoice Cycle Time and Costs
Let's be honest: manual invoice processing is slow and expensive. An employee gets a PDF, opens it, and has to painstakingly type every single detail—vendor name, invoice number, line items, totals—into your accounting software. It's a massive time sink and a huge driver of your Cost Per Invoice.
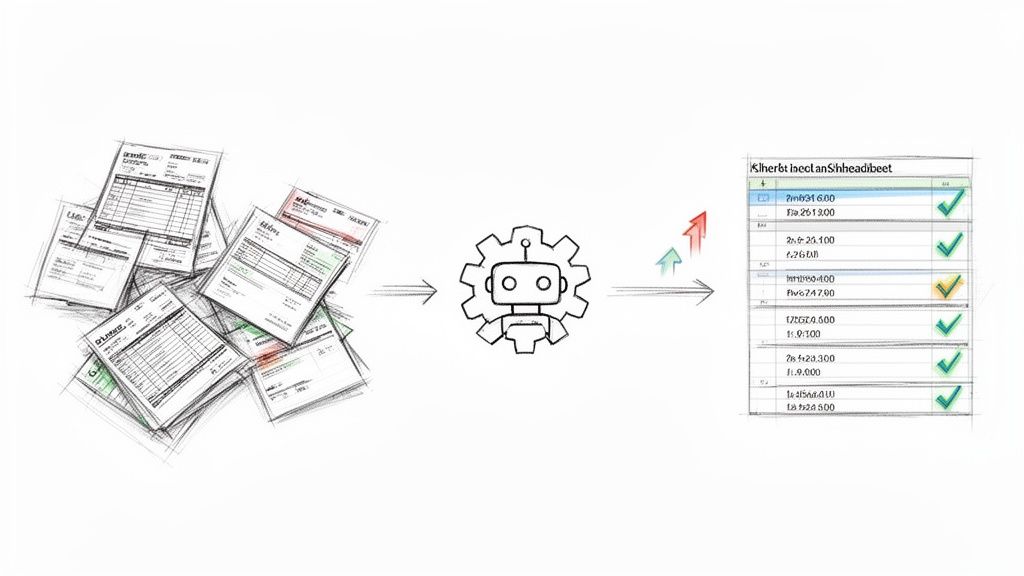
Automation completely flips this on its head.
An AI-powered tool like ExtractBill works like a digital assistant that never gets tired, bored, or makes a typo. It can instantly "read" any invoice format—PDF, email, even a scanned image—and turn it into structured, ready-to-use data in seconds.
This immediate data capture crushes your Invoice Cycle Time right from the start. What used to take several minutes of manual keying per invoice is now done in a flash. The entire AP workflow accelerates, allowing your team to handle way more invoices without adding headcount, which directly slashes your average Cost Per Invoice.
Eradicating the Invoice Exception Rate
Invoice exceptions are the silent killers of AP productivity. They bring automated workflows to a screeching halt and turn your most skilled team members into financial detectives, forcing them to hunt down the source of a mismatch or missing piece of information. This manual intervention is where bottlenecks and high processing costs come from.
Most of these exceptions are born from simple human error during data entry. One mistyped PO number, an incorrect dollar amount, or a transposed digit can send an invoice straight into the exception queue for manual review.
Even teams with some automation feel this pain. Invoice exception rates can hover around a stubborn 22.5%, meaning nearly one out of every four invoices needs to be reworked by hand. You can find more details in the Ardent Partners' 2023 report on metrics that matter at Tradeshift.com.
This is where the precision of AI is a total game-changer. By delivering data with near-perfect accuracy from the get-go, intelligent data extraction tools like ExtractBill drastically cut down on the errors that trigger exceptions in the first place. This means a much higher percentage of your invoices sail smoothly through the approval process without a hitch.
Boosting Your PO Match Rate
A high PO Match Rate is the key to achieving "touchless" invoice processing—the holy grail for any modern AP department. When an invoice perfectly matches its corresponding purchase order, it can often be approved and paid without anyone needing to lay a finger on it. That's peak AP efficiency.
Automation supercharges this metric in two critical ways:
- Flawless Data Capture: By extracting invoice data with extreme precision, AI ensures the information being matched against the PO is correct from the start. No more mismatches from simple typos.
- Systematic Validation: Automated systems can perform two-way or three-way matching instantly. They flag discrepancies in real-time for immediate attention instead of letting them clog up the workflow for days.
This systematic and accurate matching process clears the path for more invoices to flow through your system without friction, moving your team ever closer to a truly touchless operation. For a deeper dive, check out our guide to the best accounts payable automation tools. Ultimately, automation turns your AP metrics from static report cards into dynamic levers you can pull for strategic improvement.
Building Your AP Performance Dashboard
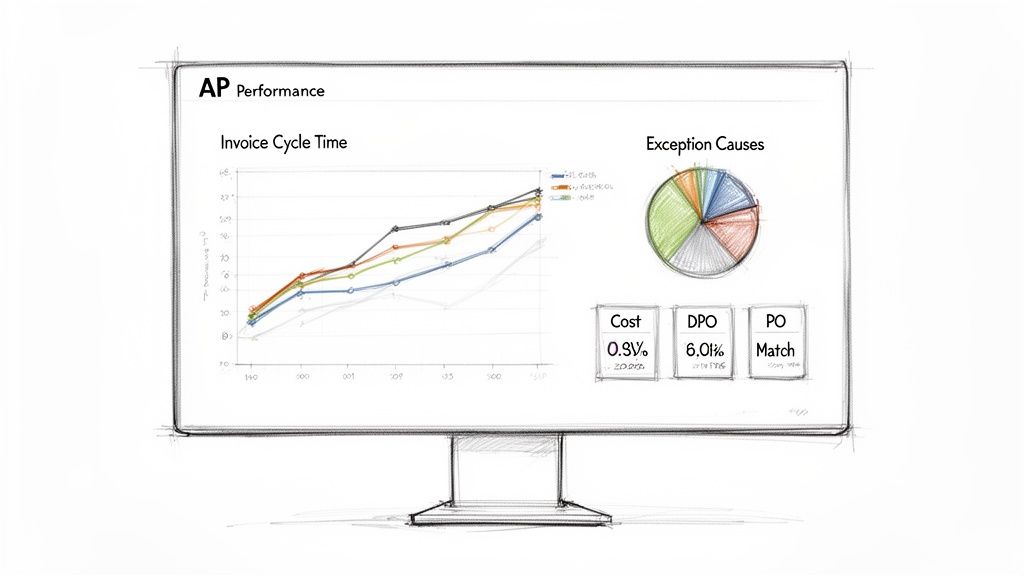
Gathering accounts payable metrics is one thing, but making them useful is another beast entirely. Data buried in a spreadsheet or a dense PDF report is basically useless—it doesn't inspire action or drive change. The real magic happens when you can visualize that data, turning raw numbers into a clear, compelling story about your department’s health.
That's precisely what a well-designed AP performance dashboard does. Think of it as the cockpit for your entire payables operation. A good dashboard gets rid of the clutter and presents the most critical information in a simple, at-a-glance format. It should immediately answer the big questions for everyone from an AP clerk to the CFO, letting them spot trends, identify bottlenecks, and celebrate wins without digging through mountains of data.
Choosing the Right Visuals for Key Metrics
How you display information is just as important as the information itself. The right chart can make data instantly understandable and actionable, while the wrong one just creates confusion.
Here’s a quick guide to visualizing your core AP metrics:
- Invoice Cycle Time: A line chart is perfect for tracking this over time. Plotting the average cycle time month-over-month will immediately show you if your efforts are paying off. Are things getting faster, or did last quarter’s numbers spike for some reason?
- Cost Per Invoice: Just like cycle time, a line or bar chart is your best friend here. It's a fantastic way to track efficiency gains, especially after you've rolled out a new automation tool or tweaked a process.
- Invoice Exception Rate: Nothing beats a pie chart for this. It gives you a clear picture of your overall exception rate and, more importantly, you can segment it by cause—PO mismatches, missing information, duplicate invoices. You'll instantly see where your team needs to focus.
Designing a High-Impact AP Dashboard
A truly effective dashboard is more than a random collection of charts. It’s a strategic communication tool that needs to be clean, focused, and designed for its audience. Remember, clutter is the enemy of clarity.
Your dashboard's main job is to provide actionable insights, not just a data dump. Every single element on that screen should serve a purpose, guiding the viewer toward a conclusion or a decision.
Focus on the essential metrics that truly paint a picture of your AP process's health. A high-impact dashboard should include:
- At-a-Glance KPIs: Put your five core metrics (Cost Per Invoice, Cycle Time, Exception Rate, PO Match Rate, and DPO) front and center with clear color-coding to show what’s on target and what isn't.
- Trend Analysis: Use line charts to show performance over the last six to twelve months. This context is crucial; a single month’s numbers don’t tell the whole story.
- Root Cause Analysis: Include visuals, like that pie chart for exceptions, that help you diagnose why a metric is off.
This approach turns your dashboard from a passive report into an active management tool. To see how clean, accurate data capture can fuel these visuals, check out our guide on using a data extraction API.
Reporting Performance to Stakeholders
Ultimately, your dashboard feeds into one of your most important tasks: proving your department's value to leadership. A monthly AP performance report, pulled directly from your dashboard, is the perfect way to show the strategic impact of your team.
For leadership, Days Payable Outstanding (DPO) is often the star of the show because it directly impacts working capital. Best-in-class teams typically keep their DPO between 45-60 days, striking a careful balance between holding onto cash and maintaining great supplier relationships. In fact, 53% of AP leaders are now focused on analytics to get a better handle on payment cycles and DPO. You can find more great insights on how top teams manage this in HighRadius's research on AP metrics. When you can present this metric clearly, you're not just talking about paying bills—you're showing how AP contributes to the company's financial strategy.
Answering Your Top AP Metrics Questions
Alright, you’ve got the theory down. You know what the key accounts payable metrics are and why they matter. But when the rubber meets the road, practical questions always come up.
Think of this section as a quick chat with a seasoned pro. We'll tackle the most common questions teams have when they start tracking AP performance, giving you straightforward answers to get you moving.
How Often Should We Be Looking at These Numbers?
This is a great question, and the answer isn't "as often as possible." The right cadence depends entirely on who’s looking at the data and what they need to do with it. You don’t need to drown everyone in daily reports.
A smarter approach is to set up a two-track reporting schedule:
- For the AP Team (Weekly): The folks in the trenches—your AP manager and specialists—need to see core operational metrics like invoice cycle time and exception rates every week. This gives them a chance to spot a bottleneck forming on Monday and fix it by Wednesday, long before it becomes a major fire drill.
- For Leadership (Monthly): Your CFO or Controller doesn't need to know about every single delayed invoice. They need a high-level view. A monthly summary showing trends in Cost Per Invoice and Days Payable Outstanding (DPO) is perfect. It helps them connect AP's performance to the company's overall financial strategy.
This way, the team on the ground has the real-time data to stay agile, while leadership gets the strategic big picture they need for planning.
We're a Small Business. Where Do We Even Start?
When you’re just getting started, the list of potential metrics can feel like trying to drink from a firehose. If you can only track one thing, make it Invoice Cycle Time.
Why that one? Because it’s the ultimate diagnostic tool. A long or unpredictable cycle time is almost always a symptom of other problems hiding in your process, like:
- Painful manual data entry.
- Approvals getting stuck on someone's desk.
- A chaotic system for managing documents.
By making it your mission to shorten your invoice cycle time, you’ll naturally be forced to find and fix those root causes. It gives you the most direct, actionable feedback loop, making it the perfect starting point for any team.
Don't think of Invoice Cycle Time as just a speed metric. It’s a friction detector. Every day you shave off the cycle is a sign you've smoothed out a rough spot in your process. Get this right, and you'll be amazed how other metrics like cost per invoice start to improve on their own.
How Can We Get Our PO Match Rate Up?
A low PO match rate is a classic AP headache. It grinds what should be a fast, automated workflow to a halt, forcing your team into manual detective work. The fix isn't just an AP problem—it's a company-wide one that starts long before an invoice arrives.
Here are three concrete steps you can take to fix it:
- Draw a Line in the Sand on PO Compliance: The number one cause of mismatches is a purchase made without a proper PO. This has to stop. Partner with your procurement or purchasing department to create a clear policy: no PO, no payment. Period.
- Train the Entire Team: Make sure everyone who buys things understands why creating an accurate PO matters and how to do it correctly. At the same time, communicate your requirements to your vendors—they need to know to include the correct PO number on every single invoice.
- Stop Relying on Manual Keystrokes: Even with perfect compliance, human error during data entry will still cause mismatches. A typo in the PO number or a misplaced decimal in an amount is all it takes. Using a tool to automatically and accurately extract invoice data is the final piece of the puzzle. It ensures the data you’re trying to match is correct from the very beginning.
Boosting your PO match rate is a team sport, but the reward is huge: a smoother, faster, and more hands-off AP process for everyone.
Ready to slash your invoice cycle time, eliminate data entry errors, and supercharge your AP metrics? ExtractBill uses advanced AI to convert any invoice into clean, structured data in seconds. Stop chasing typos and start making strategic decisions. Try ExtractBill for free and process your first three documents today.
Ready to automate your documents?
Start extracting invoice data in seconds with ExtractBill's AI-powered API.
Get Started for Free